Writing
Machine Learning Math Foundations (3) — Probability
Preface: probability can feel abstract; use samples to approach truth, and master basics like mean and variance.
Preface: probability can feel abstract; use samples to approach truth, and master basics like mean and variance.
Permutations and Combinations
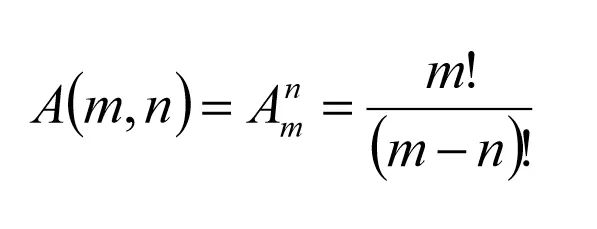
Foundation for formulas. Permutation:
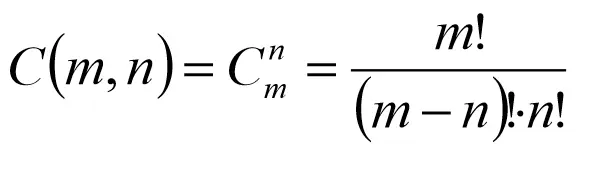
Combination:
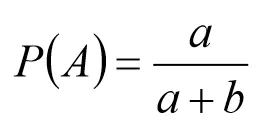
Classical Probability
Event A: a elementary outcomes favor A, b do not.
Joint Probability
Both events occur: P(AB).
Conditional Probability
Probability of A given B has occurred:
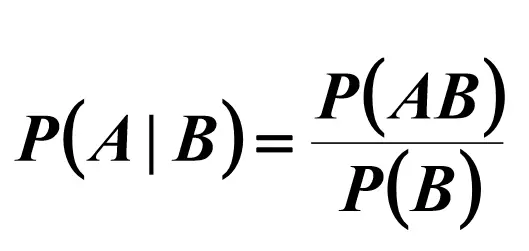
Corollary: n events occurring together:

Law of Total Probability
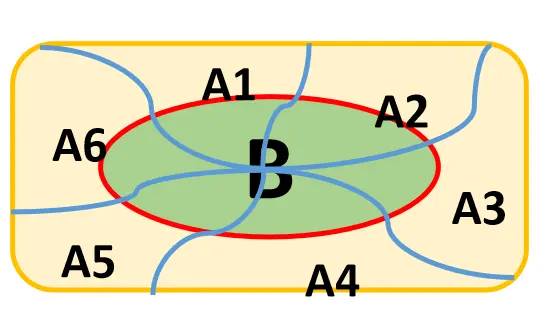
Sample space Ω partitioned by events A₁, A₂, …, A_n as in the figure:
For any event B, the law of total probability:
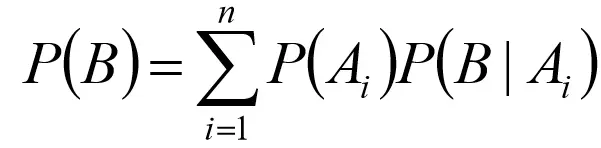
Also called the result probability formula (B is usually the outcome event).
Bayes’ Formula
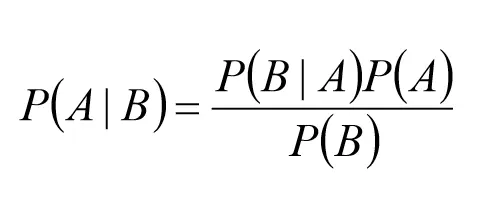
Provable from conditional probability:
If A₁, A₂, …, A_n partition Ω and P(B) > 0:
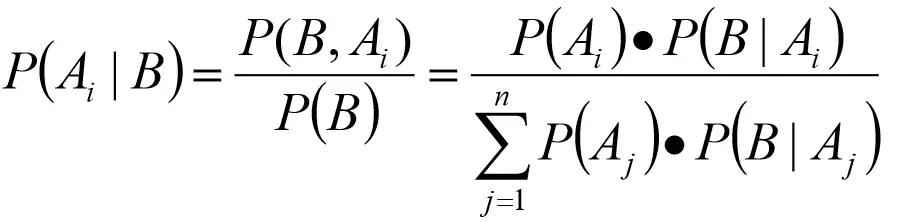
Also called the cause probability formula—finding causes given B has occurred.
Independent Events
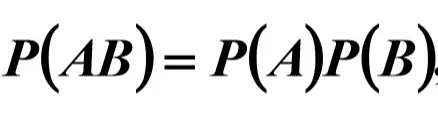
A and B unrelated—independent:
Random Variables
Concrete events A, B as variables and functions over sample space. Examples: dice roll X = number shown; cars passing an intersection 8:00–9:00, Y = count—Y is a random variable.
Discrete Random Variables
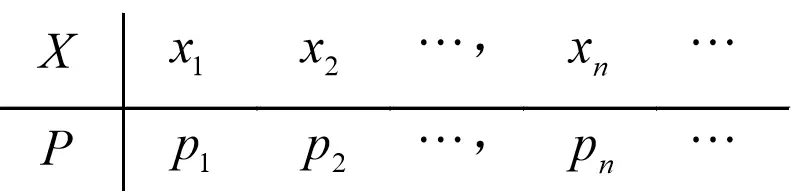
- Bernoulli distribution:
 Notation:
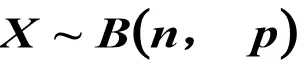
 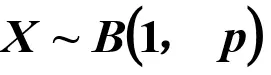 Parameter: one trial; p = success probability. (2) Binomial: probability of k successes in n trials:
  Notation:
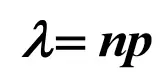
  (3) Poisson: limit of binomial as n → ∞:
  Parameter:
  (4) Geometric: trials until first success in Bernoulli trials:
  (5) Hypergeometric: N items, M defective, draw n; X = defect count in sample:
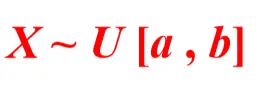
  ## Continuous Random Variables CDF F(x), PDF f(x). (1) Uniform:
 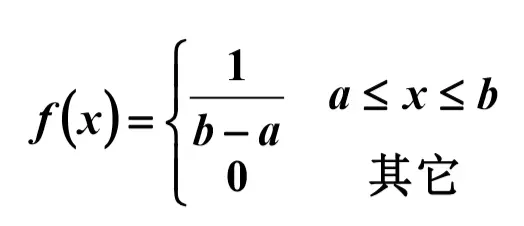 Notation:
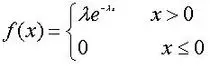
  Exponential: X ~ Exp(λ), mean 1/λ, variance 1/λ²: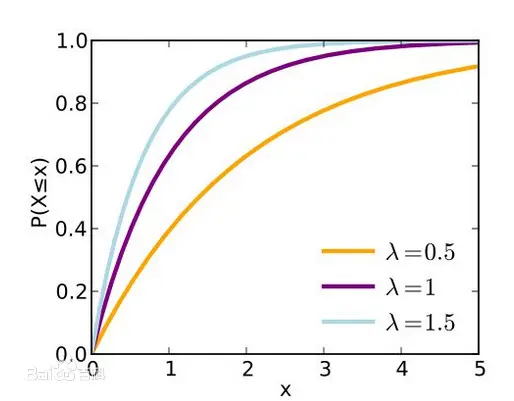
 (3) Normal:
 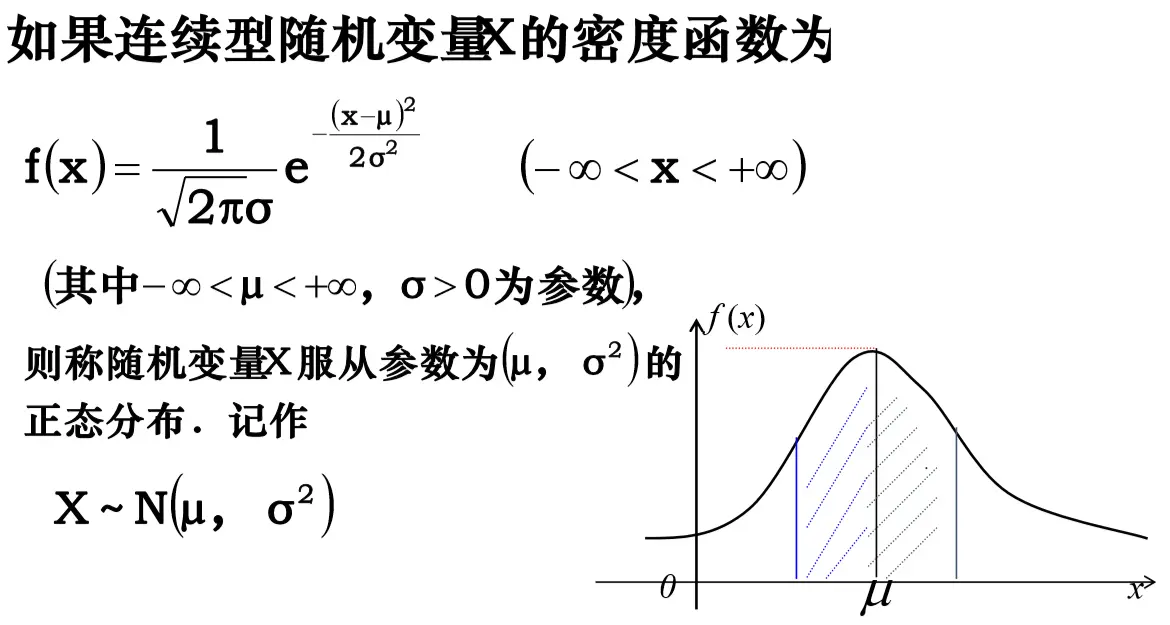 For general normal, convert to standard normal first. ## Expectation and Variance
After studying, prove expectations and variances of each distribution for deeper understanding.
-
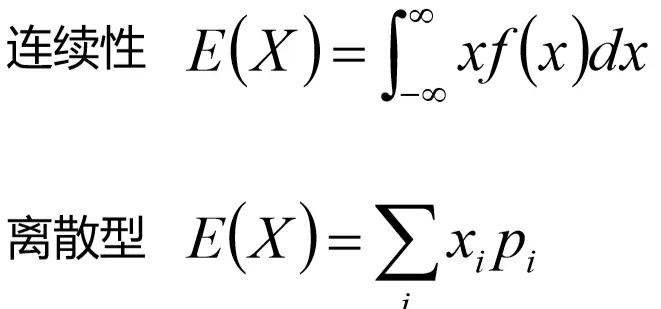
Expectation (mean): probability-weighted average—sum of outcomes times probabilities. Often denoted:
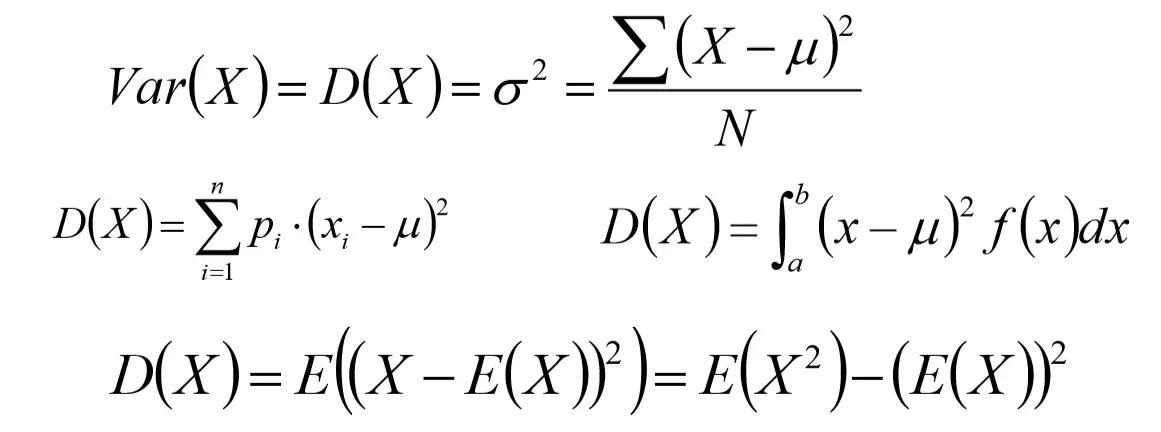
 Variance measures spread from the mean:
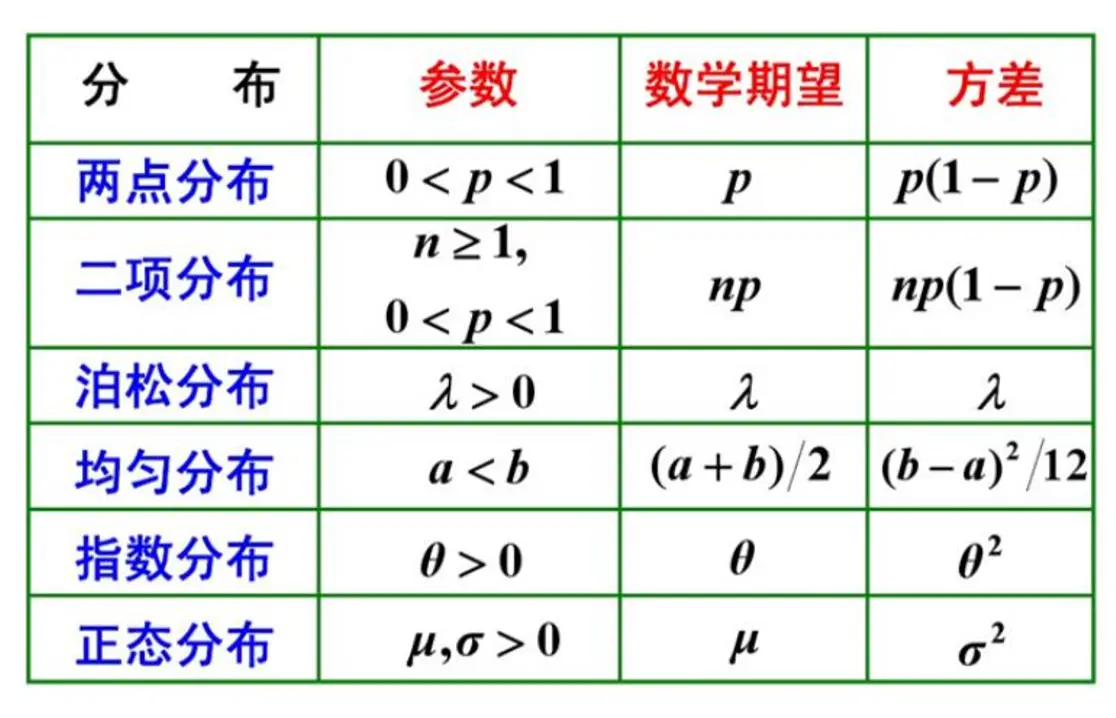
  Common distributions:
  Covariance (cov): overall error between two variables.
 -
Correlation (corr): degree of linear relationship.
-
Central and raw moments: E(X) is first raw moment; Var(X) is second central moment; Cov(X,Y) is second mixed central moment.
-
Kurtosis: peakedness of the distribution.
-
Skewness: left or right skew.
Three Basic Theorems
- Chebyshev’s inequality: X with mean μ, variance σ²; for any ε > 0:
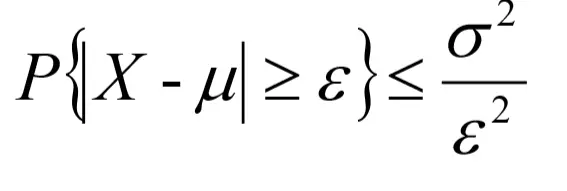 Meaning: smaller variance → event {|X − μ|

Since f(x) > 0, log preserves monotonicity:

You might also like: my pandas notes for ML, my matplotlib notes for ML, my NumPy notes for ML