Writing
High-Dimensional Data Visualization — t-SNE
Uses, innovations, and algorithm details for t-SNE dimensionality reduction.
Uses
For dimensionality reduction and visualization of high-dimensional data. Compared with PCA’s linear reduction, visualization is more friendly. Similar samples are modeled by nearby points; dissimilar samples by distant points with high probability.
Innovations
Introduces probability—nearby points are more likely to appear together: t-SNE minimizes the Kullback-Leibler (KL) divergence between two distributions over embedded point positions. Makes data structure clearer. Below compares PCA and t-SNE:
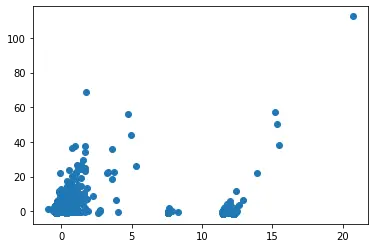
PCA reduction
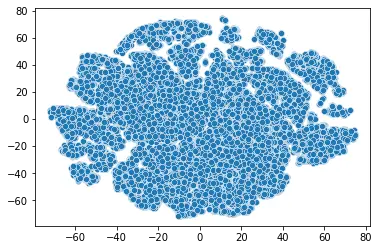
t-SNE reduction
Algorithm Details
Two steps 1: Build probability distribution P of points in high-dimensional space
- How? Make nearby points have high probability
2: Reconstruct this distribution in low-dimensional space
Assume the distribution follows a Gaussian: https://zhuanlan.zhihu.com/p/148170862 https://zhuanlan.zhihu.com/p/57937096