Writing
Similarity Network Fusion for Aggregating Data Types on a Genomic Scale
Notes on SNF: fusing similarity networks across genomic data types for clustering and survival prediction.
-
Link: https://github.com/yik-cyber/SNFtool — Summary: Similarity Network Fusion aggregates different genomic data types. Inspired by multi-view methods in computer vision, the paper designs a graph fusion network to address the difficulty of jointly processing genomic data. Patients with the same cancer form a cohort; different genomic measurements per patient build separate graphs, then a fusion method merges them into one graph containing all genomic information. Clustering on the fused graph yields cancer subtypes; regression predicts patient survival risk. Framework and model structure:
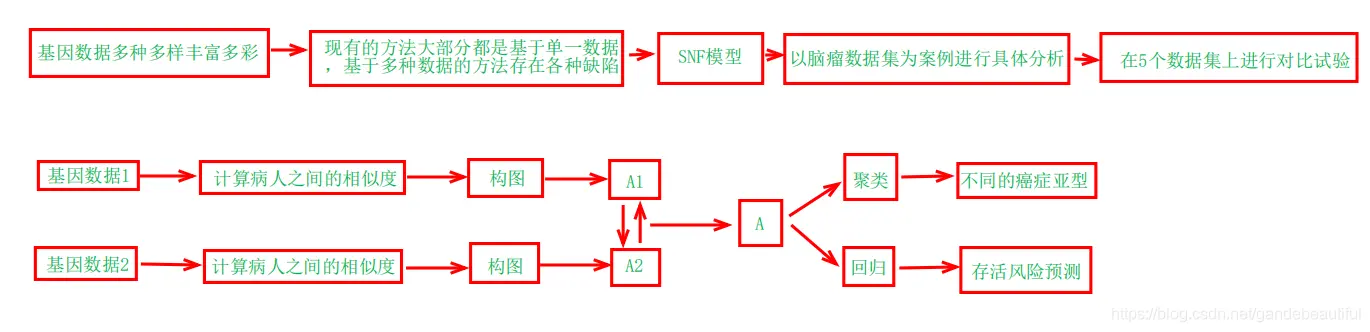 Problem statement Existing methods combine all genomic data types but have issues: Concatenation: low signal-to-noise; - Independent analysis then merge: separate outputs, hard to unify; - Prior gene selection: focuses on shared signal, loses complementary information; - ML clustering: very sensitive to number of pre-selected genes.
 -
This paper proposes SNF (Similarity Network Fusion): build a similarity network for each data type;
-
Fuse all similarity networks nonlinearly into a single output network.
-
SNF advantages: captures both shared and complementary information across genomic types for fuller extraction;
-
Handles multiple genomic data types, robust to noise, works with few samples;
-
Iterative fusion removes weak edges and strengthens strong ones.
-
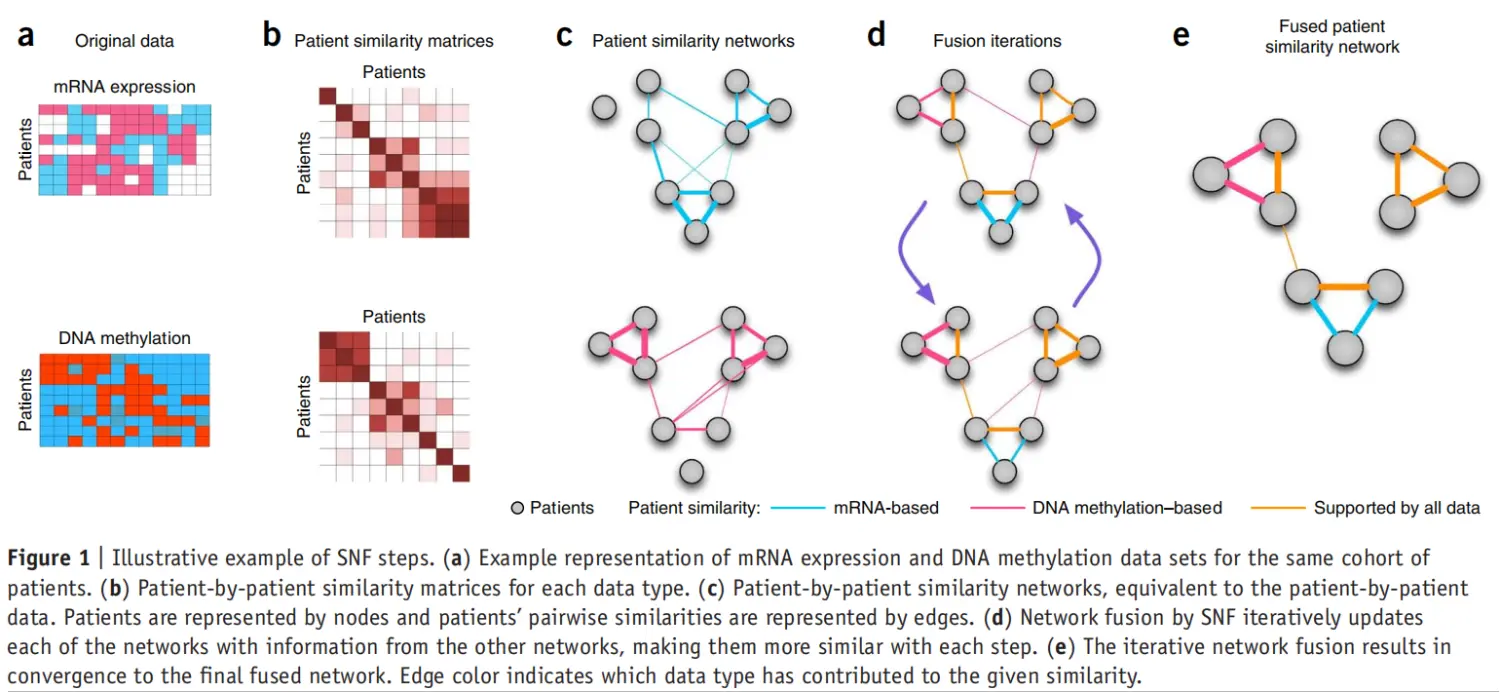
Method Below fuses two genomic types as an example. Raw data: patients with the same cancer; DNA methylation and mRNA per patient. (a) two genomic profiles per patient; rows patients, columns genes. (b) pairwise similarity matrices. (c) graphs from similarity; nodes patients, edge weights similarity. (c) single-color edges—each edge from one data type. (d) fusion iteration; two graphs learn from each other until convergence → (e) fused graph with edges from both types.
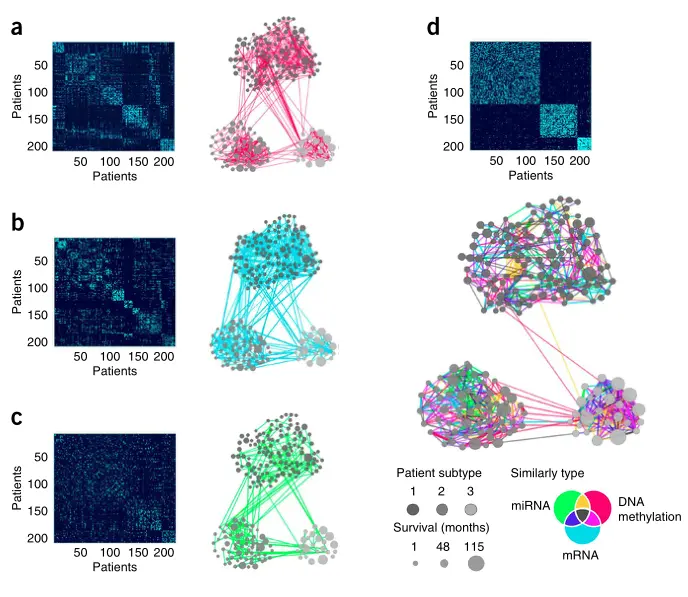
 A glioma dataset illustrates SNF with three genomic types: build three graphs, fuse, cluster with spectral clustering into subtypes, use the network as regularization in regression for survival risk.
  Similarity formula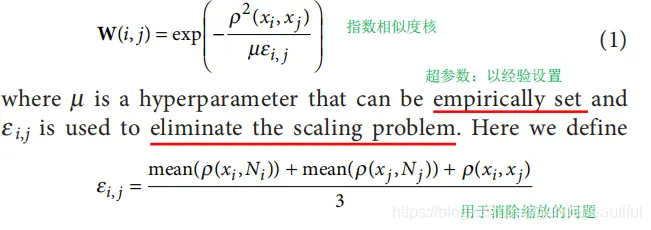
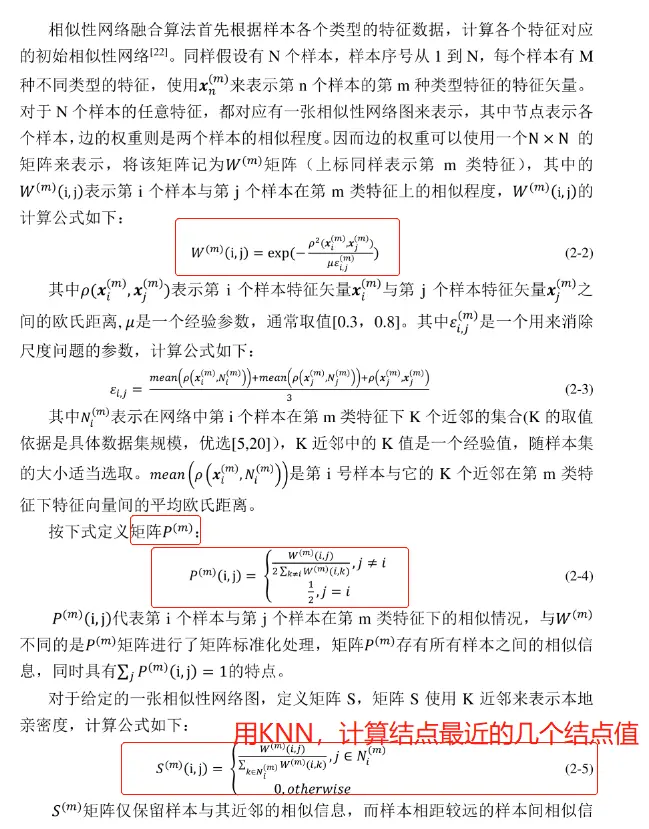
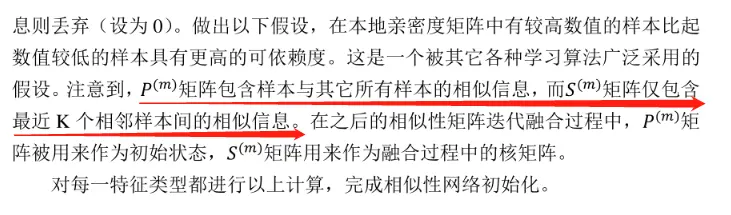 Graph fusion iteration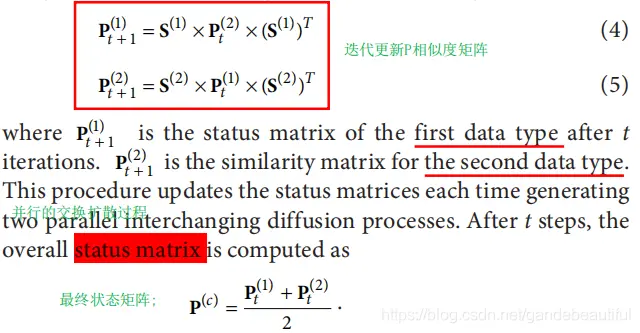
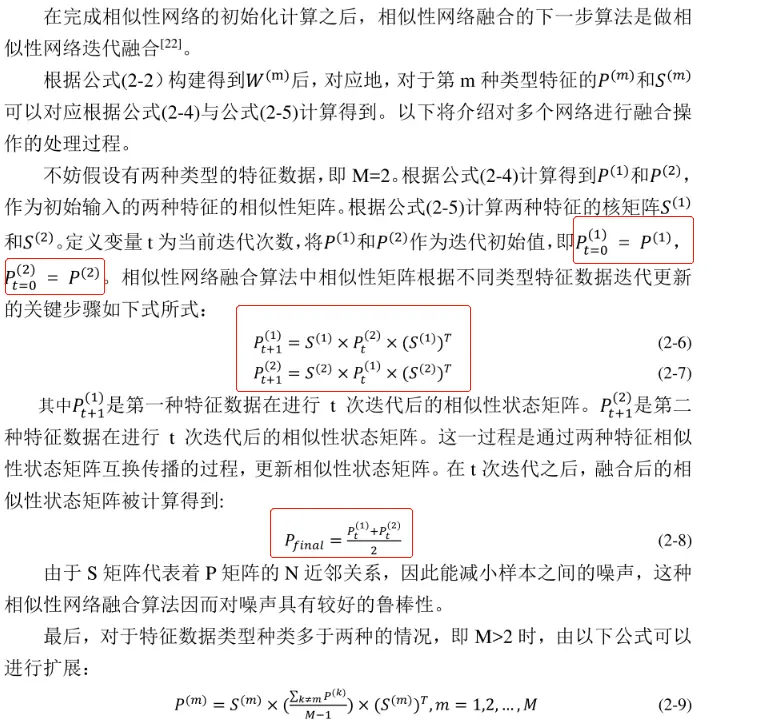 Coding Split data in two parts
 -
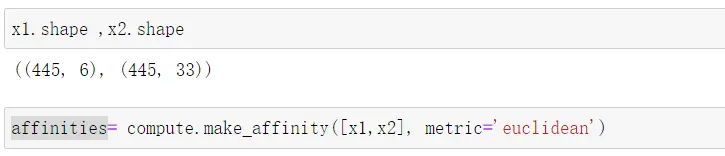
Compute similarity matrix from raw data
-
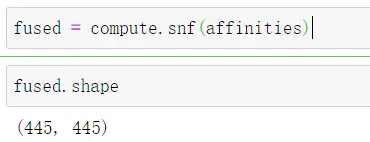
Fuse similarity matrices
-
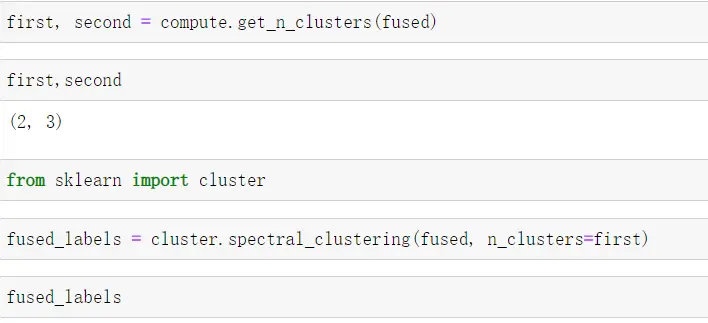
Cluster fused matrix into two clusters
-
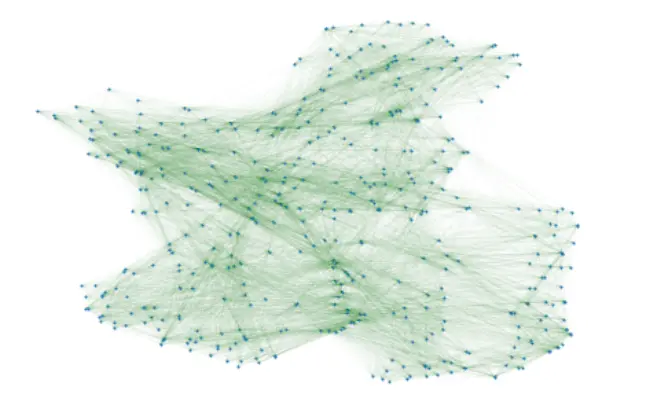
Visualize similarity networks
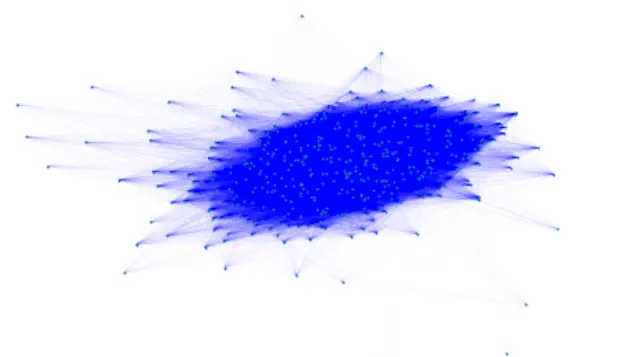
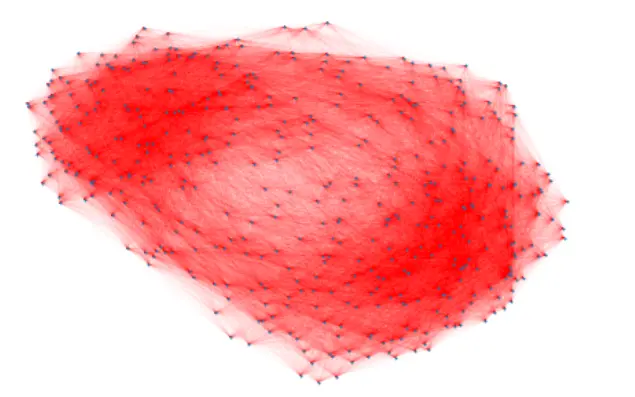
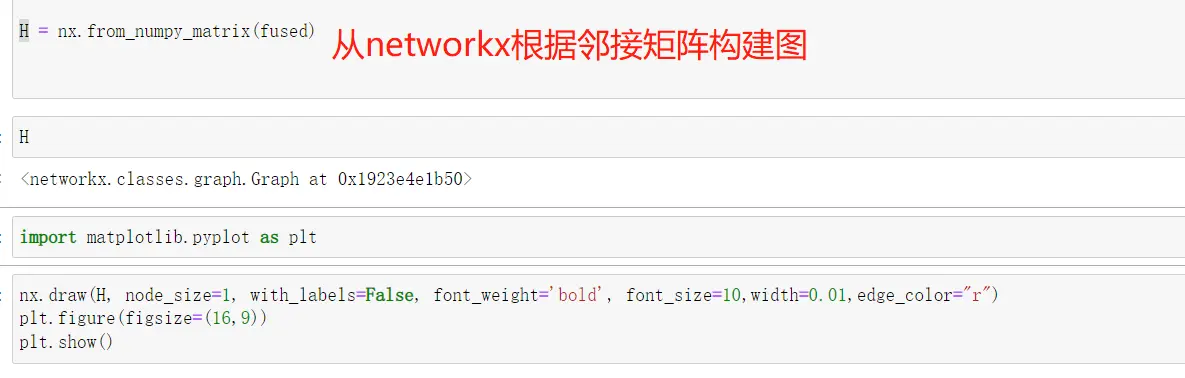
-
Binarize similarity matrix
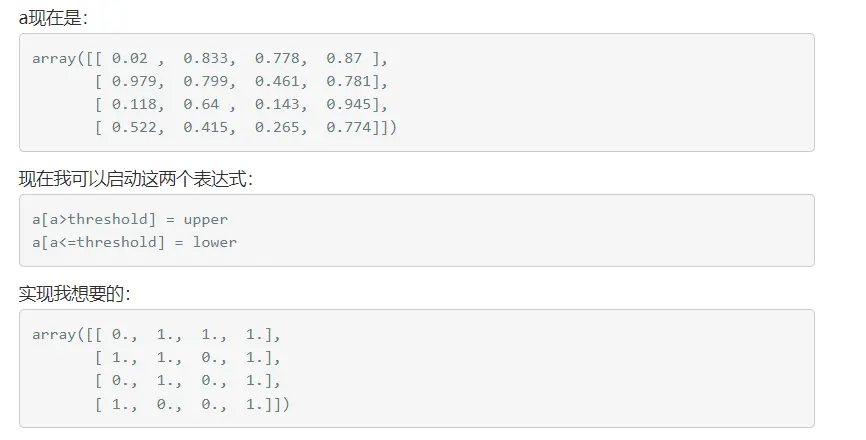
-
On the model
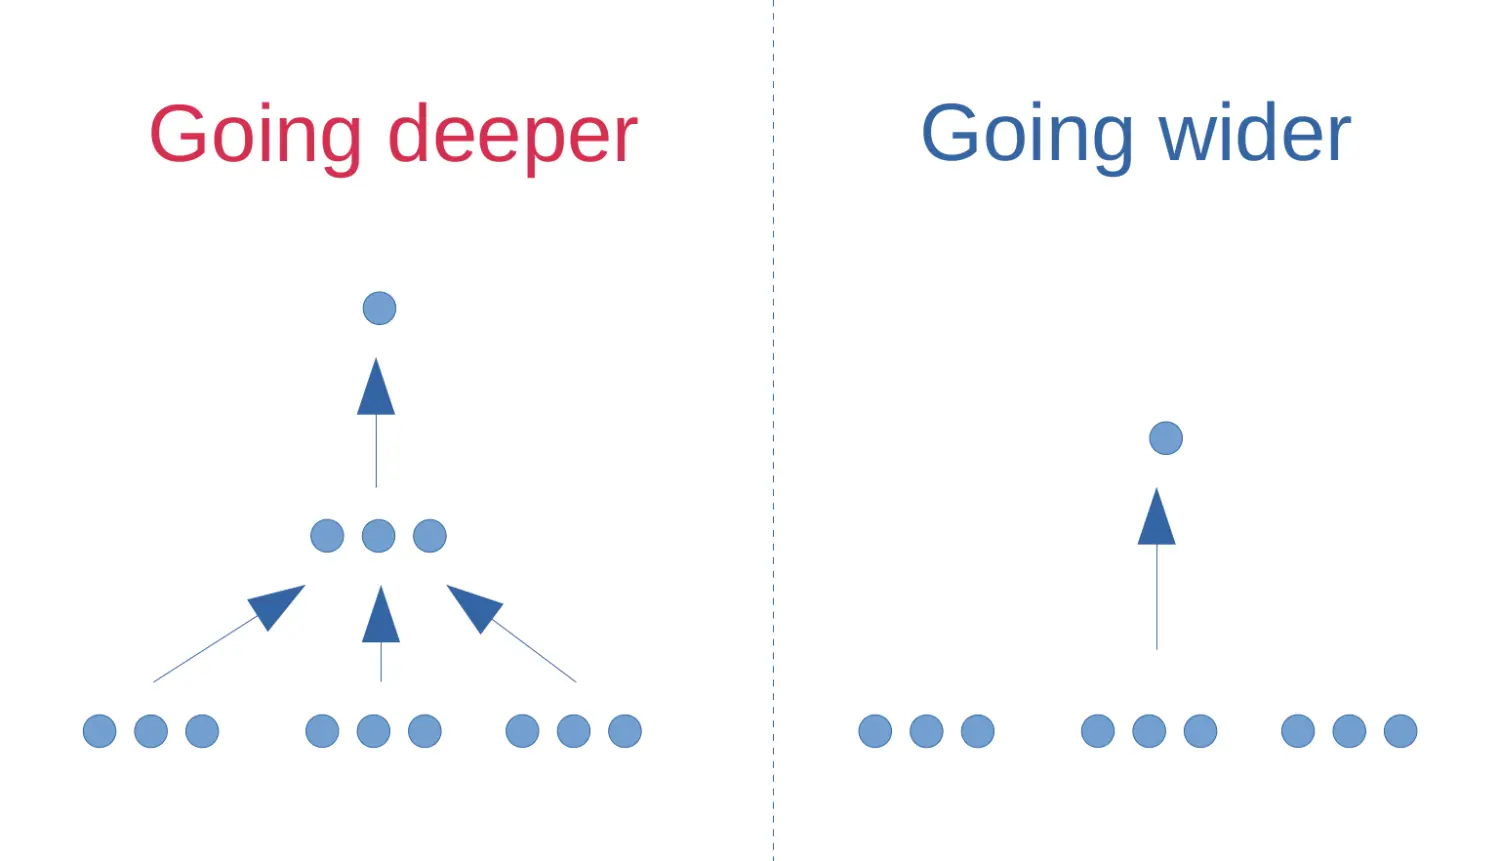
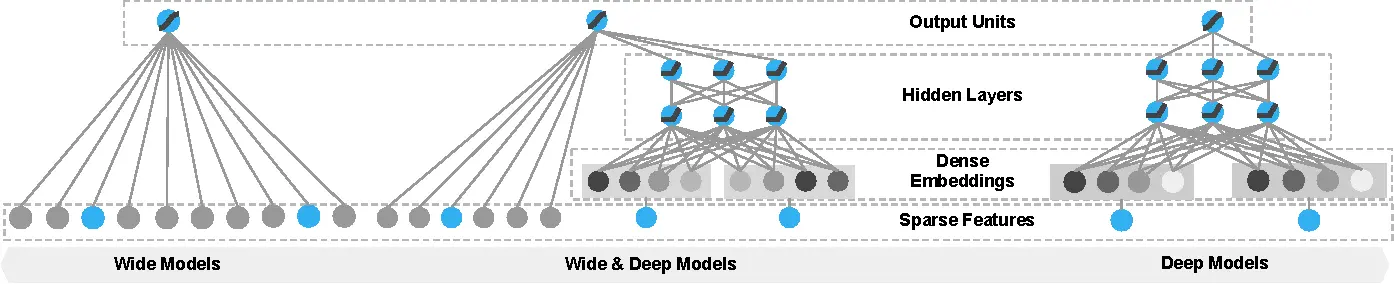
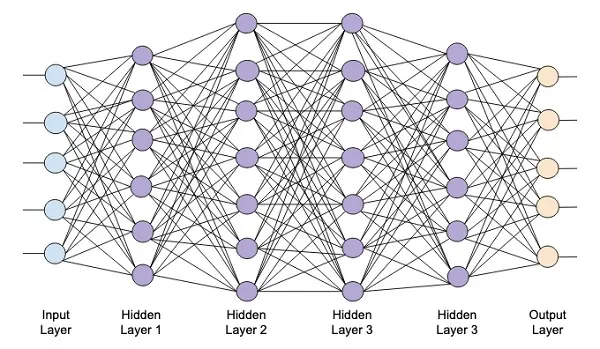
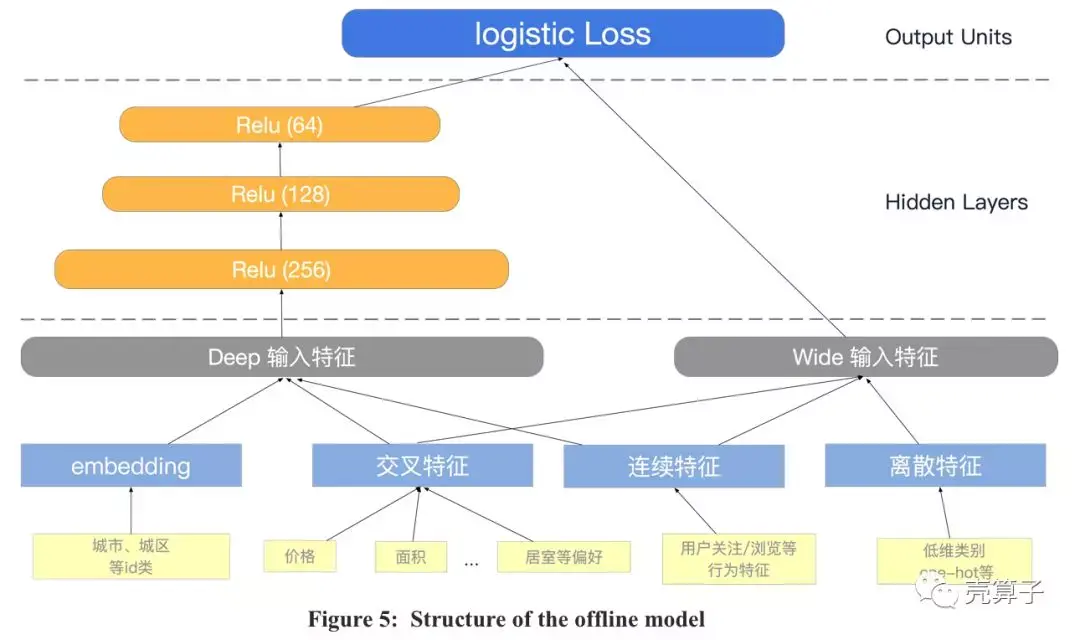
-
Related article https://www.sciencedirect.com/science/article/abs/pii/S016926071930327X?via%3Dihub